¶ Introduction
The dataviewer is a simple data visualization application which displays the process data which were recorded in a database. It basically displays the process overview.
It mainly deals with:-
- Grouping of processes according to adjustable criteria(program name,tool number etc).
- Display of process results in particular using the validation module.
- Supports a "click in" into components,from the actual component,down to the process data.
- Supports customizable usecases for validations.
- Supports AI based algorithms and deep learning neural networks for running validations on data to predict if a process is good or bad.
¶ System Architecture
Data Viewer is a customizable data visualization and data validation application which reads the data from database.
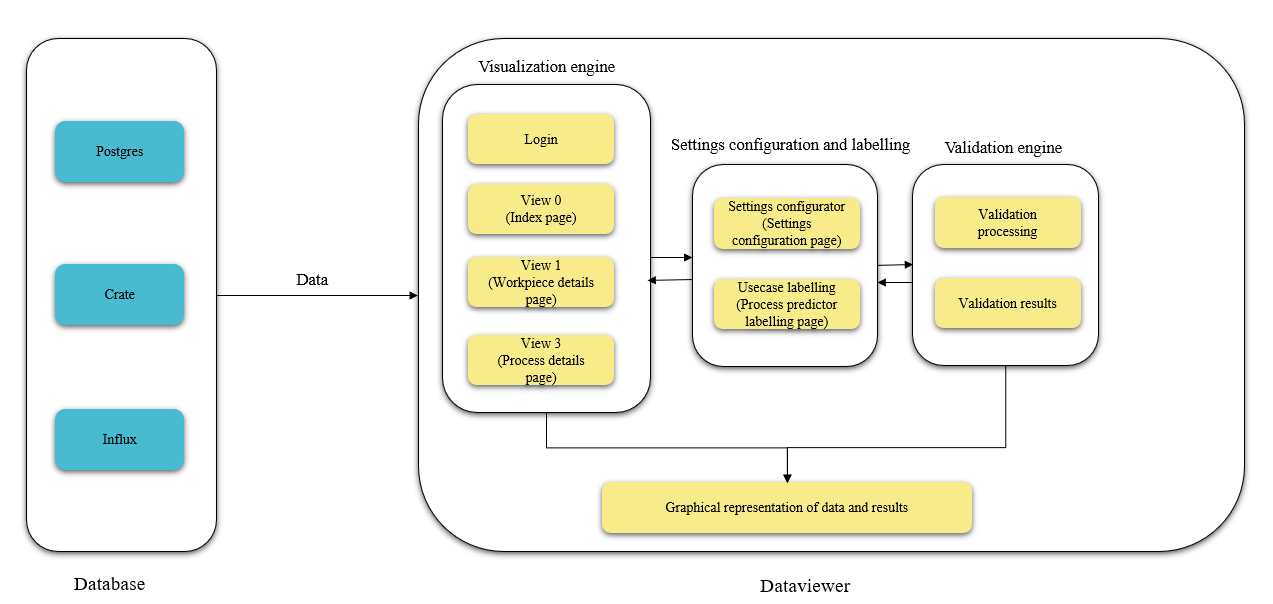
As we can see from the above diagram,database is the input source of dataviewer application.Process data from database is passed on to the data viewer application and this data is visualized in the form of data tables and graphs. Data is also validated by executing customizable usecases and then its results are displayed in the UI.
Workflow of ValidationEngine:-
- The ValidationEngine initiates the validation process by querying the database for relevant data.
- The Database responds with the requested data.
- The ValidationEngine executes the specified validation use cases, leveraging external dependencies when necessary.
- Upon completion of validation, the ValidationEngine updates the validation results in the Database.
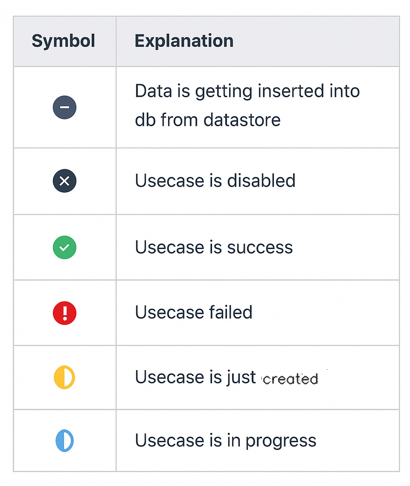
- The updated validation results are available for retrieval or further analysis. These results are also dynamically presented in the user interface, categorized according to their respective validation states for better clarity and usability.
Validation states in Dataviewer UI are:-
There are mainly 3 views for dataviewer view 0(index page),view 1(WorkPiece details page) and view 2(ProcessDetails page). For more details regarding various pages in the ui refer Description of UI pages and Components. Importance of dataviewer is that all the three views are fully customizable. Refer Configuration to know more about customization of views.
All the views deal with data in tabular form.Graphical representation of data can be achieved in view 2 since there is a dropdown of column names which can be customized according to our requirement.
Dataviewer application is built using python dash framework.Some of its advantages are:
-
Optimize Performance: We can perform fast numerical computations, compile Python code and identify workflow blockers. Handles incoming requests quicker through job queueing while offloading long-running queries or CPU-intensive tasks on the back end.
-
Scalable Multitenancy: A Dash app is stateless by design — multiple teams can access and use the application at the same time. Scales easily to service a larger request load and supports Kubernetes and Docker applications.
-
Open Source:We can import and download its Core, DAQ, Bio and HTML components into Python, R and Julia-based apps. Its functionality can be maximised through community-contributed attributes, such as Dash Trich Components, Material UI, Pivottable, Tabulator, the Download Component and many more.
-
Data Visualization: We can create interactive applications with sliders, dropdowns and map scientific, financial and business charts in 2D and 3D through the plotly.js graphing library.
¶ Installation Steps
¶ docker-compose file
Create a docker-compose.yaml from the below contents.
services:
  postgres:
    image: "postgres:13"
    container_name: postgres
    restart: unless-stopped
    ports:
      - "5432:5432"
    volumes:
      -  ./data/postgresql:/var/lib/postgresql/data
    environment:
      POSTGRES_USER: postgres
      POSTGRES_PASSWORD: postgres

  dataviewer:
    image: dataviewer:latest
    hostname: dataviewer
    restart: unless-stopped
    ports:
      - "8081:16000"
      #Mapping for RESTAPI_PORT needs to be 1:1
      - "8082:8082"
    depends_on:
      - postgres
    volumes:
      - ./data/dataviewer:/app/data/
      - ./data/dataviewer/models:/app/models
      - ./data/dataviewer/graphs:/app/src/assets/images/graph
      - ./svg:/app/src/assets/svg
    environment:
      - RESTAPI_PORT=8082
      - BACKEND_CONNECTION_TARGET=postgres
      - BACKEND_CONNECTION_PORT=5432
      - STATUS_MONITOR_BACKENDHOST=kairo.brinkhaus-gmbh.de
      - STATUS_MONITOR_BACKENDPORT=6001
      - STATUS_MONITOR_BACKENDBNAME=test
      - STATUS_MONITOR_BACKENDUSERNAME=user
¶ Run the docker compose file to start up the container
sudo docker compose up -d
¶ To check if the containers are up and running,
docker ps
¶ Configure dataviewer ui
Dataviewer ui can be configured by referring to Configuration
¶ Configuration
- Download the Dataviewer application. For getting information on downloading it, please goto Installation Steps.
- Setup the process Identifiers and Attributes for all the three views via the webUI.
Note that when data is sampled from multiple machines/sources, all sources should read from the same set of channels. Mismatches in channel configurations between machines can cause issues in the dataviewer application when data is being visualised (however, data is properly pushed into the database).
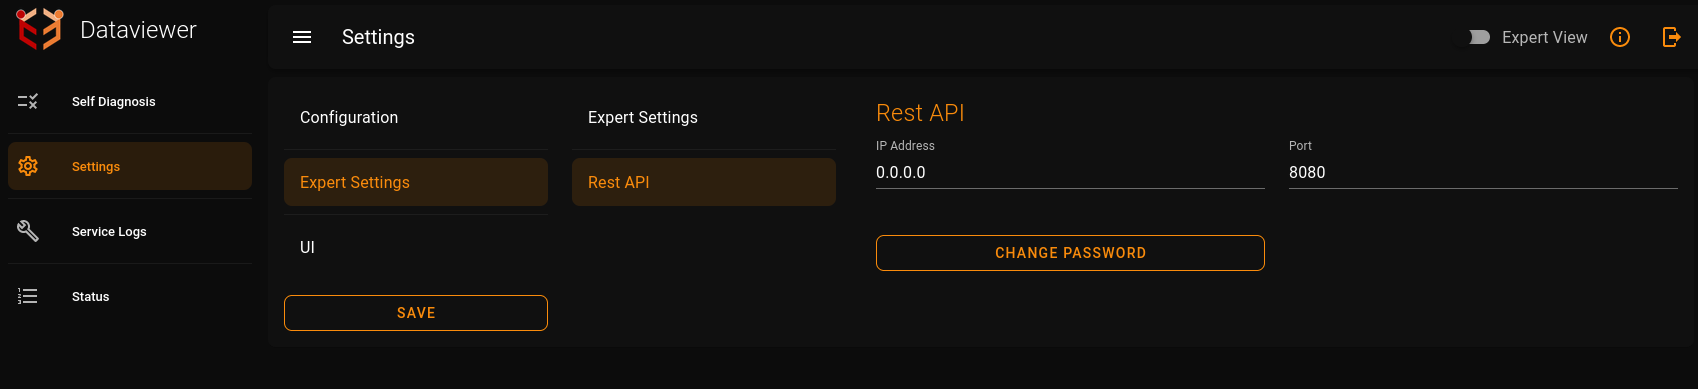
Dataviewer application comes along with a web UI for modifying configuration,viewing the online status of the application, looking at logs and so on. The RESTful service webUI is configured by default on the port 8080.
For customizing the RESTful service webUI address and port, provide it in the section Settings -> Expert Settings -> Rest API -> Port.

- restServiceIp: Defines the IP address for the RESTful service (e.g., "0.0.0.0").
- restServicePort: Specifies the port for the RESTful service (e.g., 8080).
For customizing the configuration, the details are explained below :
Dataviewer Application port: provide it in the section Settings -> Expert Settings ->Expert Settings -> Application Port.By default it is set to 16000.
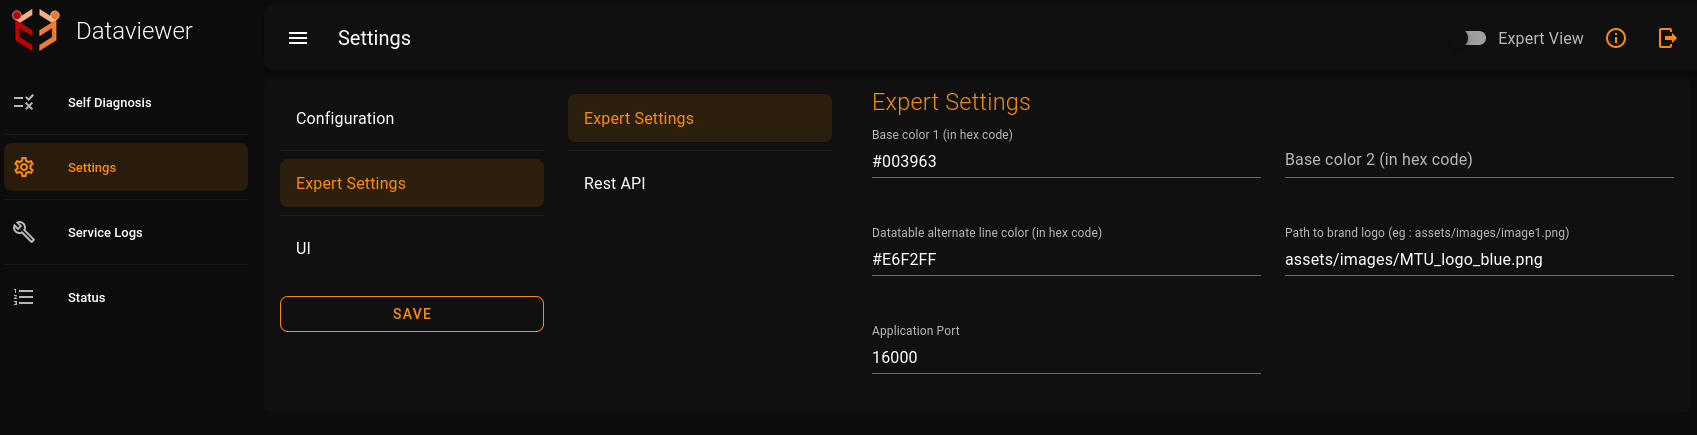
Base color 1 of dataviewer UI:baseColor is the color of navigation bar and footer of all the pages in the dataviewer UI. It is by default set to a shade of blue.We can provide it in the section Settings -> Expert Settings ->Expert Settings -> Base color 1.
Base color 2 of dataviewer UI:baseColor2 is by default set to none.Hence white color is the default baseColor2 of UI.This is the background color of the pages excluding the areas of the data table,navigation bar and footer.We can provide it in the section Settings -> Expert Settings ->Expert Settings -> Base color 2.
Datatable alternate line color of dataviewer UI:It is the color of alternate rows in the data table of dataviewer. It can also be customized according to our requirement.We can provide it in the section Settings -> Expert Settings ->Expert Settings -> Datatable alternate line color.
Path to brand logo of dataviewer UI:Here we can provide path of the required logo image.Logo image is present at the top right corner of dataviewer UI.We can provide it in the section Settings -> Expert Settings ->Expert Settings -> Path to brand logo.
database: Specifies the type of database used by the DataViewer module (currently supported is CrateDB.)
- host : Defines the host for the database.
- port : Specifies the port for the database.
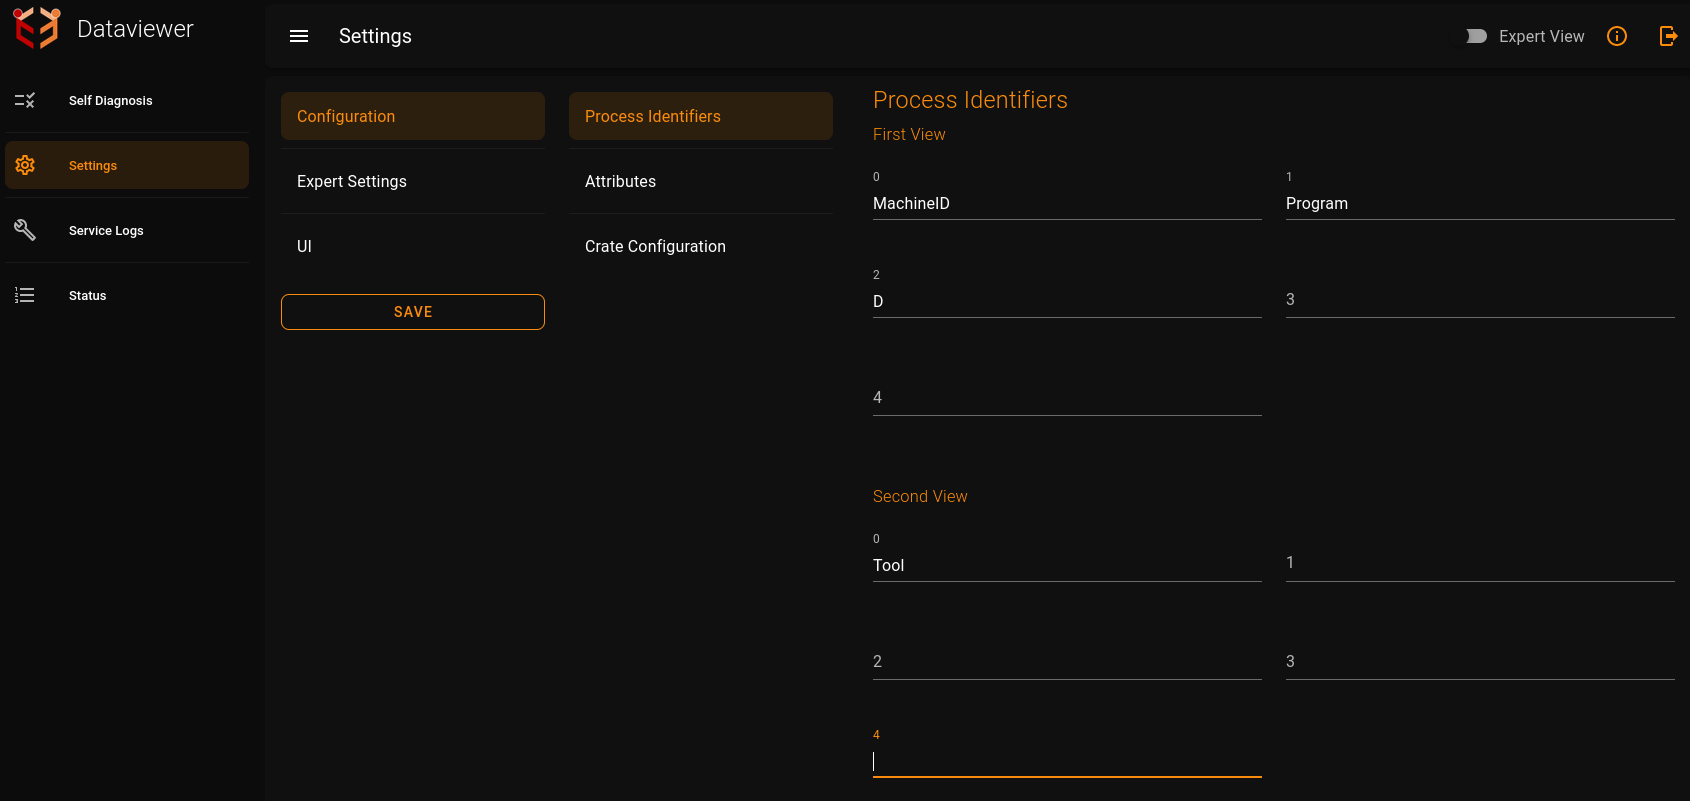
Process Identifiers:Process Identifiers that has to be displayed can be set here.For all the three views we can set the process Identifiers.Each process identifier name has to be mentioned in Configuration -> Process Identifiers -> Views(First View,Second View,Third View).
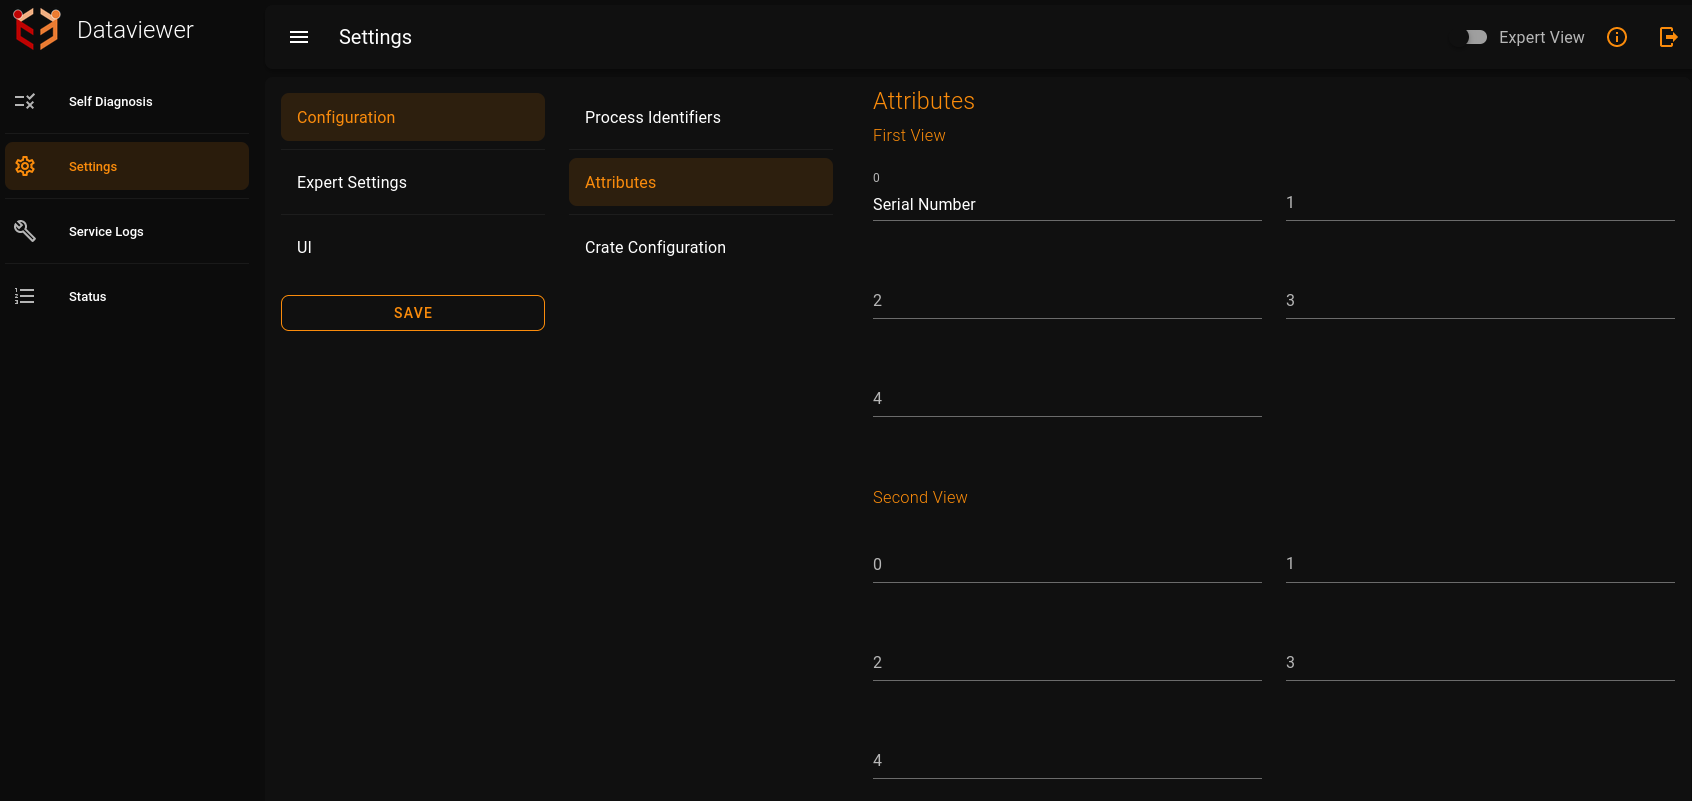
Attributes:Attributes that has to be displayed by the dataviewer can be set here..For all the three views we can set the process Identifiers.Each process identifier name has to be mentioned in Configuration -> Attributes -> Views(First View,Second View,Third View).
Now the application has been configured.
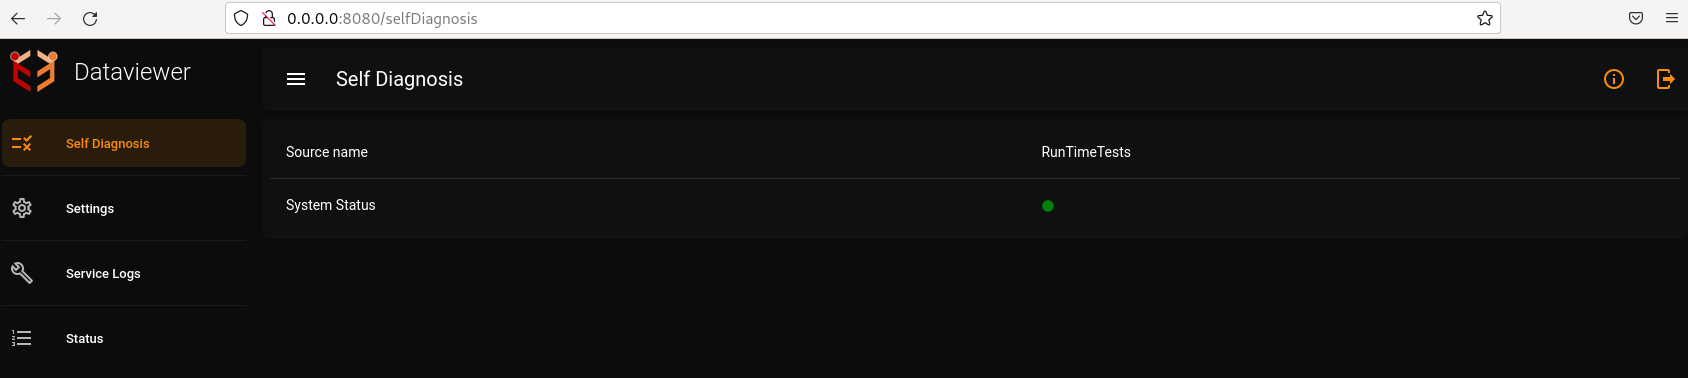
¶ Runtime Tests
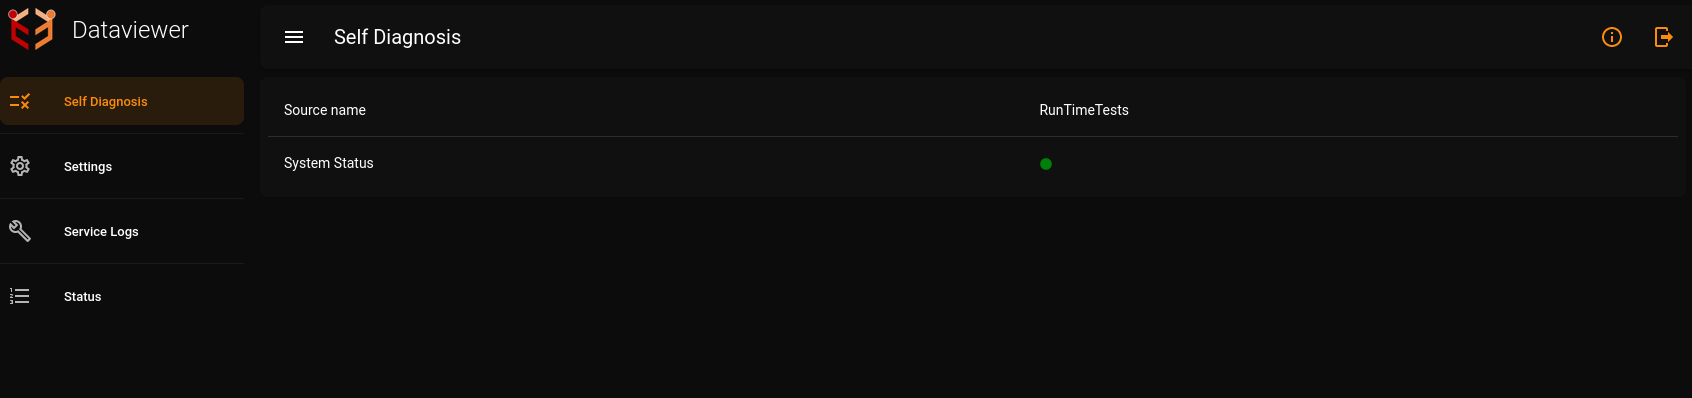
DataViewer has a Runtime Tests system which enables it to run tests online(when the dataviewer application is itself running). The system returns 'System status' as 'true' if there are no errors found during the runtime tests or if there are only non-critical errors which do not affect the execution critically. It returns 'System status' as 'false' if there are any critical errors. There is a unique identification number for each of the error messages.
The error messages are grouped on the basis of the number of input sources. Numbers 0-9999 is for first gateway service (input) and 10000-19999 for the second and so on.
The runtime tests system ensures that the validation usecases run perfectly and there are no issues in the execution of these usecases. This ensures high quality live data validation.
An example of when the runtime tests have executed successfully and the application is in good state.
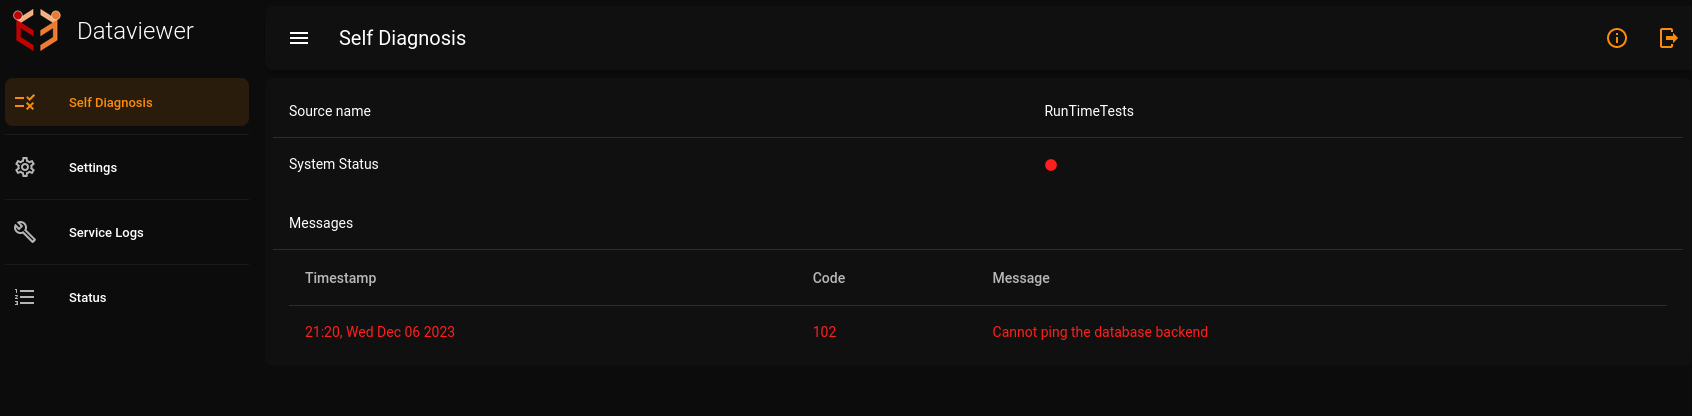
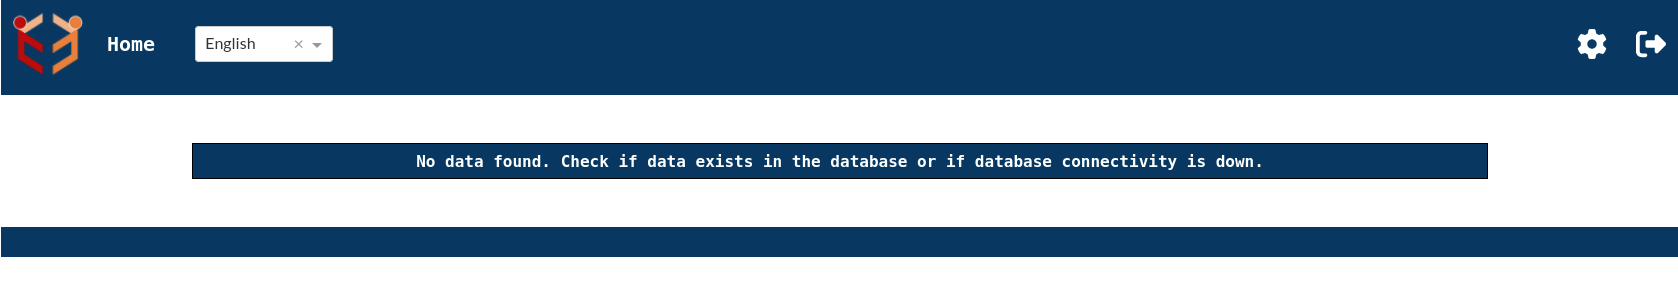
An example of when the runtime tests encounter a failure and the application has critical errors (in this example, database is down) :
¶ Testing of Dataviewer UI
After starting up the dataviewer application,when we click on http://127.0.0.1:16000/(if port is set to the default value of 16000 and if the crate database is up and running and contains some process data) then after logging in,we will be able to see the data table in the index page.For more info regarding pages refer Description of UI pages and Components.
Note that if the database is down or database has no data currently then index page will be as shown below:
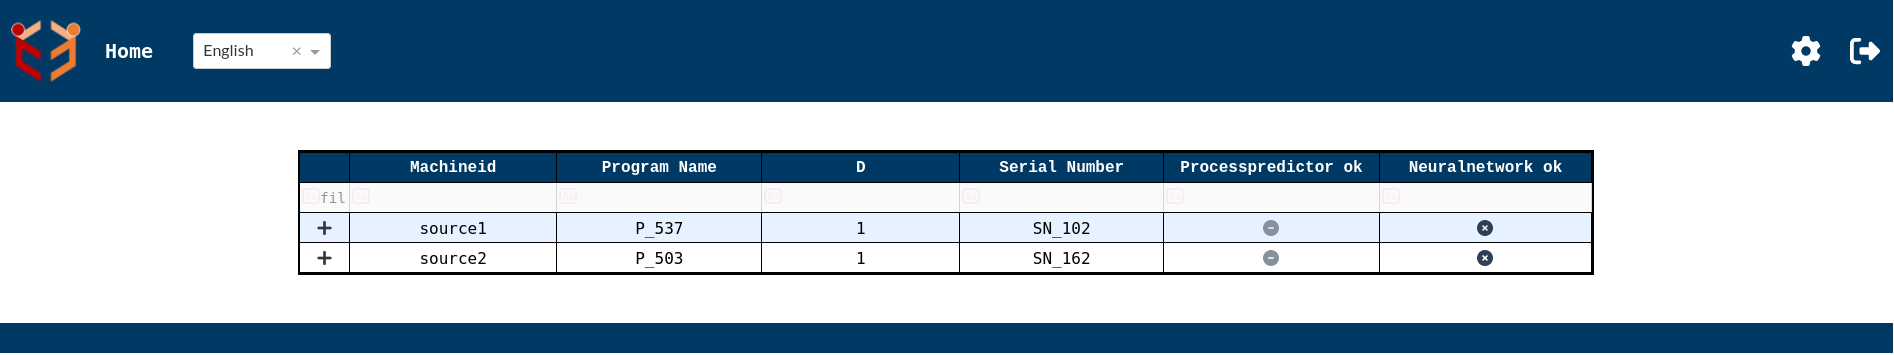
When the database is up and has some data,the index page will be as shown below.Here we can see the data in tabular form.
¶ Description of UI pages and Components
UI mainly consists of 6 pages:-
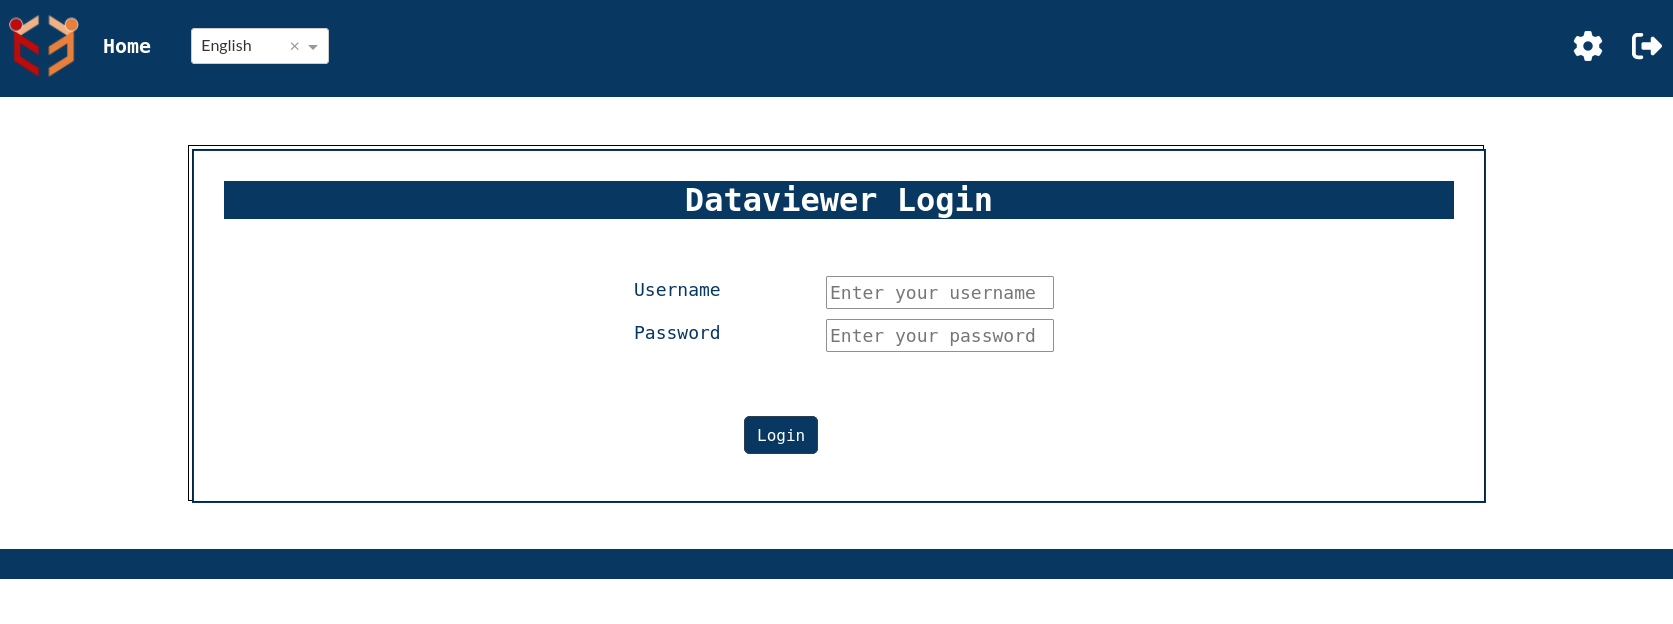
- Login Page-There is a login page which requires the user authentication to continue into the index page.On the top right corner we have the logo which can be customized(refer configuration page to know about customization) .Then we have the home icon and the dropdown which enables us to select the preferred language from the given choices(English,French and German).Towards the right side of the navigation bar we can see settings gear wheel and and logout button.Settings gearwheel when clicked will redirect to dataviewer settings page which also requires user authentication.
- Index Page-Immediate page that comes up after logging in using the credentials is the index page.The default page shows the complete work pieces or the machines that are identified by machine id. It shows a summary of these machines or work pieces.This example shows Machine ID,Program Name,D and Serial Number in index page since by default Machine ID,Program Name and D are set as default processIdentifiers and Serial Number is set as default attribute for view 0 in settings.This can be fully customized according to the requirements.

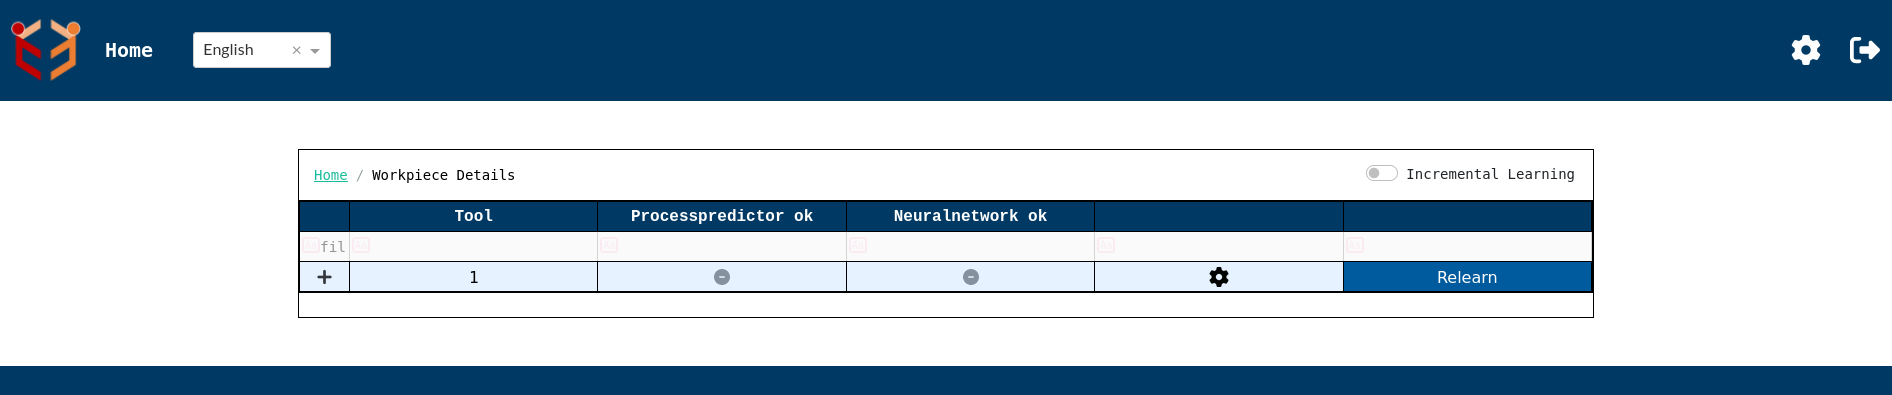
- WorkPiece Details Page-In the configuration above,if we click on the '+' icon to the left of Machine ID column then we get work piece details page which shows details regarding Tools of a work piece.Please note that here also Tool is set as the default processIdentifier for view 1. This page includes a 'Relearn' button, which is utilized in the ProcessPredictor use case to trigger model relearning when necessary. At the top right corner of the page, there's a toggle switch labeled Incremental Learning. This switch controls whether the system uses incremental learning or full retraining from scratch when updating a machine learning model.
Before initiating the Relearn process, ensure the following steps are completed:
-
Configure Settings:
Click on the settings icon(located to the left of Relearn button) on the WorkPieceDetails page (as shown above).
Fill in all necessary configuration fields to ensure the processpredictor usecase operates with the correct parameters. -
Input Training Values:
Navigate to the Process Predictor Labelling page.
Enter the appropriate Measured value fields required for training the model.
Detailed instructions on how to fill in these fields are provided in the following sections.
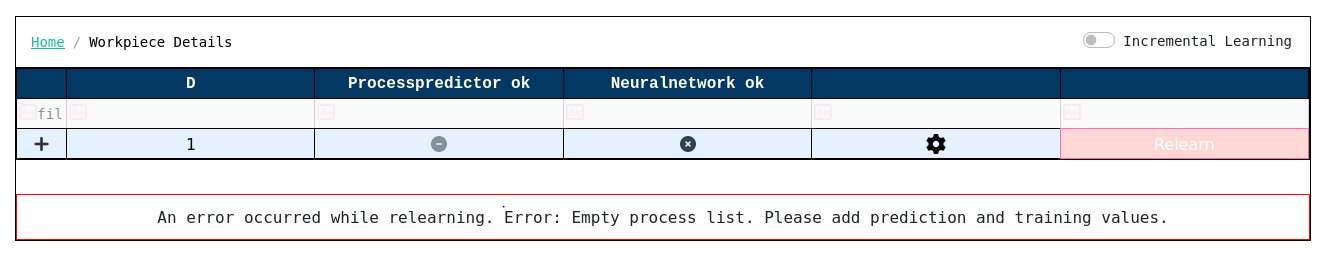
Only after completing both steps should you proceed to click the Relearn button. Clicking on Relearn button without filling these fields can cause an error as shown above.
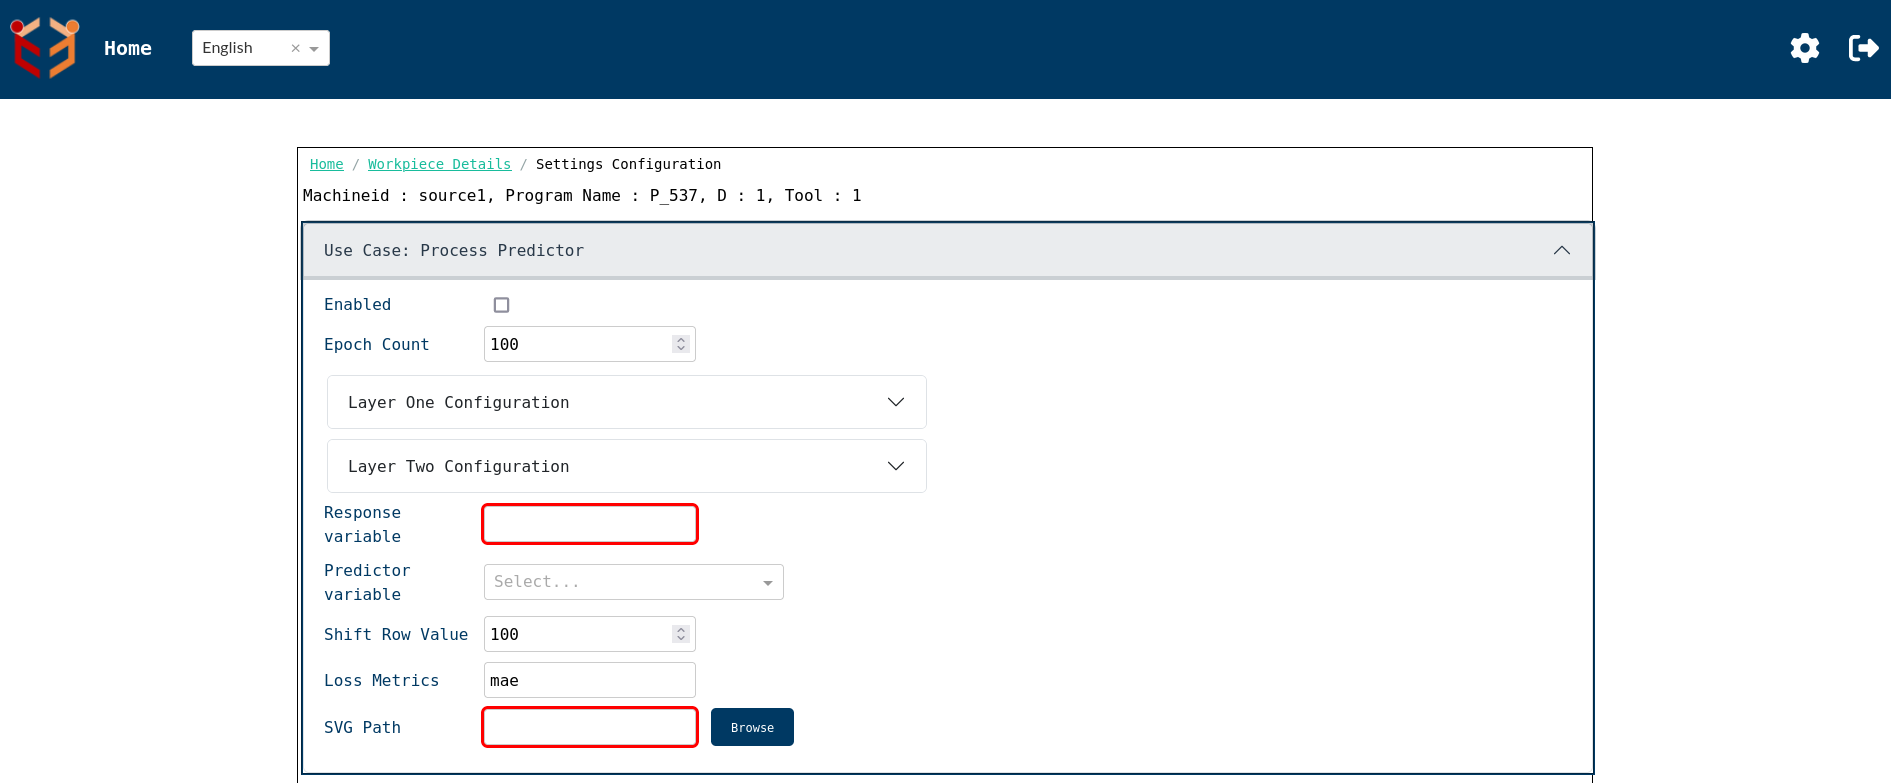
- Settings Page- In the configuration panel shown above, clicking on the Settings icon (located to the left of the Relearn button) allows you to configure the settings for both the NeuralNetwork and ProcessPredictor use cases for processes having same set of identifiers or settingsid.
First let us go through ProcessPredictor settings:-
-
Enabled : Activates or deactivates the Process Predictor use case for the current configuration. By default, it will be in disabled state.
-
Epoch Count : Defines the number of training iterations the model should run.
-
Layer One Configuration / Layer Two Configuration : Allows for the specification of neural network layers used in training. Here neuron count and activation function of the corresponding layers can be set.
-
Response Variable : Specifies the target/output variable the model is trying to predict. It is a required field.
-
Predictor Variable : Selects the input/features used to train the model. It is a dropdown from which we can select any one of the value columns as input.
-
Shift Row Value : Introduces a lag or shift in the dataset to support time-series prediction.
-
Loss Metrics : Defines the metric used to evaluate model accuracy during training.
-
SVG Path : Sets the SVG for all the processes having the same set of identifiers or same settingsid. It is also a required field.
Now let us go through NeuralNetwork settings:-
-
Enabled : Activates or deactivates the Neuralnetwork use case for the current configuration. By default, it will be in disabled state.
-
Epoch Count : Defines the number of training iterations the model should run.
-
Layer One Configuration / Layer Two Configuration : Allows for the specification of neural network layers used in training. Here neuron count and activation function of the corresponding layers can be set.
-
Response Variable : Specifies the target/output variable the model is trying to predict. It is a required field. In this case, it will be any one of the value columns.
-
Shift Row Value : Introduces a lag or shift in the dataset to support time-series prediction.
-
Max Timeout : Time-based constraint on how long the neural network training process is allowed to run before it is forcibly terminated.
-
Threshold Loss : Used to halt training once a specified level of loss is reached.
Once the configuration for Neuralnetwork is saved, the usecase will run for all newly incoming processes with the same set of identifiers automatically. There is no button to initiate the learning process here.
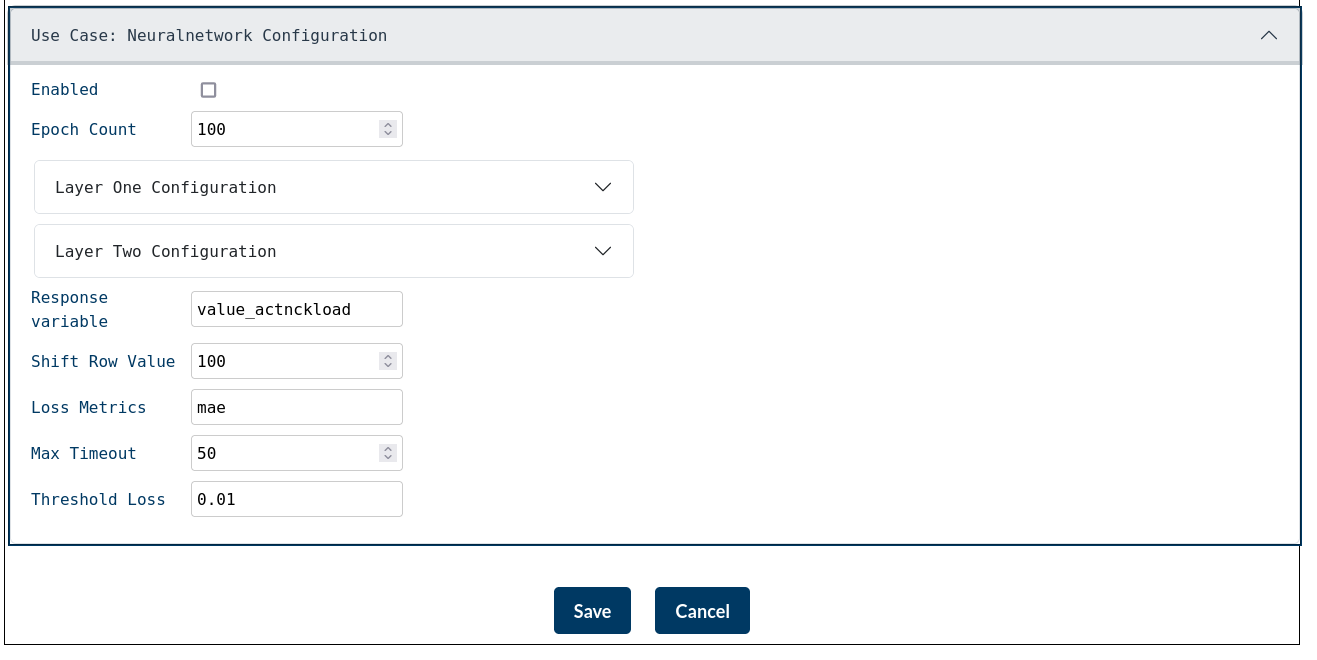
After configuring all the parameters, click the "Save" button to store the current configuration in a process-specific JSON file. This configuration will be applied to all processes that share the same set of identifiers. Clicking the "Cancel" button will discard all unsaved changes and revert the configuration to its previously saved state.
- Process Predictor Labelling Page- In the Process Details Page given below,if we click on the svg icon on the right most side, then we get Process Predictor Labelling page. This page has a radio button group which allows us to select between training and prediction. By default the value will be prediction.
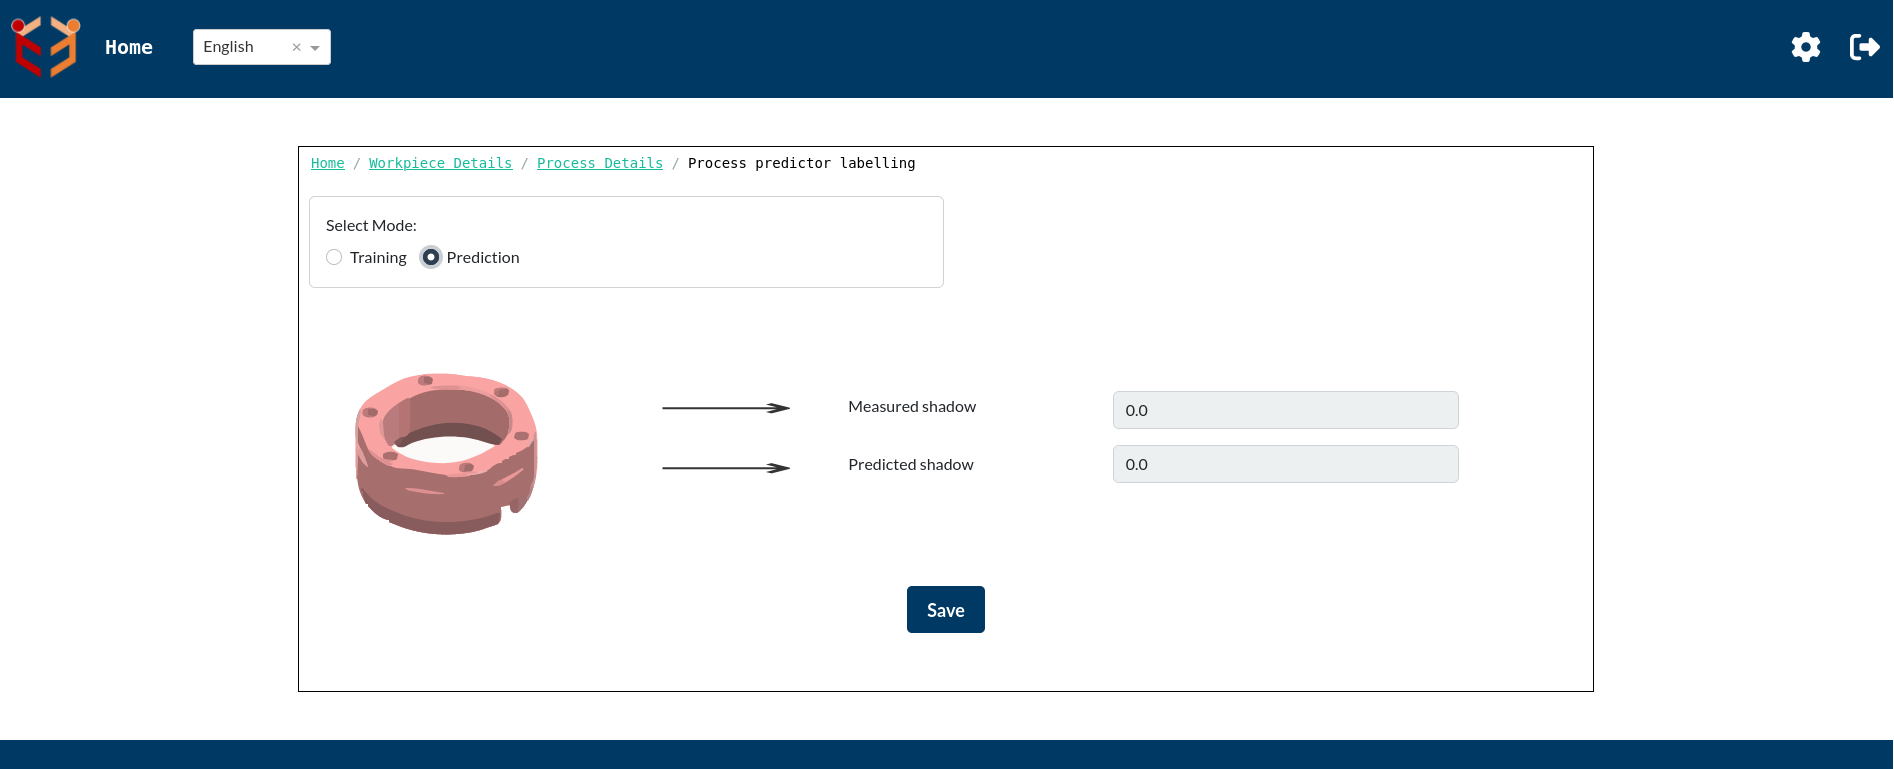
The above image shows default look of Process Predictor Labelling Page.
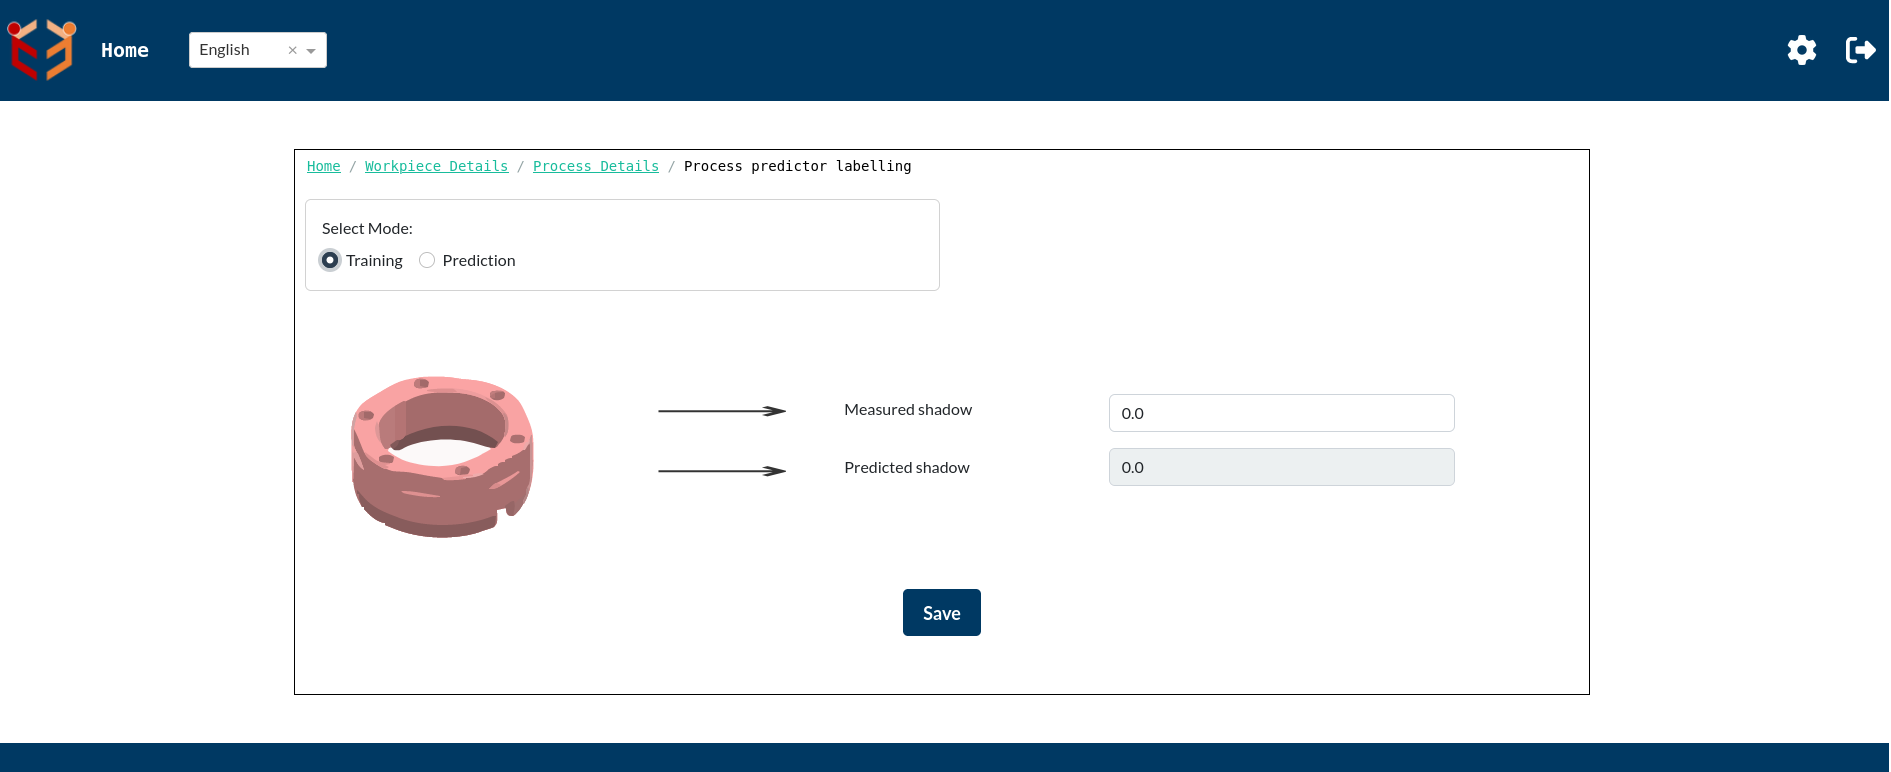
The image above illustrates the Process Predictor Labelling page when Training Mode is selected for a specific process.
In Training Mode, the user is required to manually enter the Measured Value.
In this case, the Measured shadow field is editable because "shadow" has been configured as the response variable.
The Predicted shadow field remains read-only and may be empty or pre-filled depending on previous prediction runs or model states.
Once the measured value is entered, click the "Save" button to store this data in training mode for the current process.
This step is essential to include the current process in the model’s training dataset.
Processes explicitly marked in Training Mode are used for training the prediction model.
All other processes where Training Mode is not selected will be automatically considered for prediction purposes.
Now since the settings page as well as the Process Predictor Labelling Page for Process Predictor usecase has been filled, we can use Relearn button to execute Process Predictor usecase for these processes.

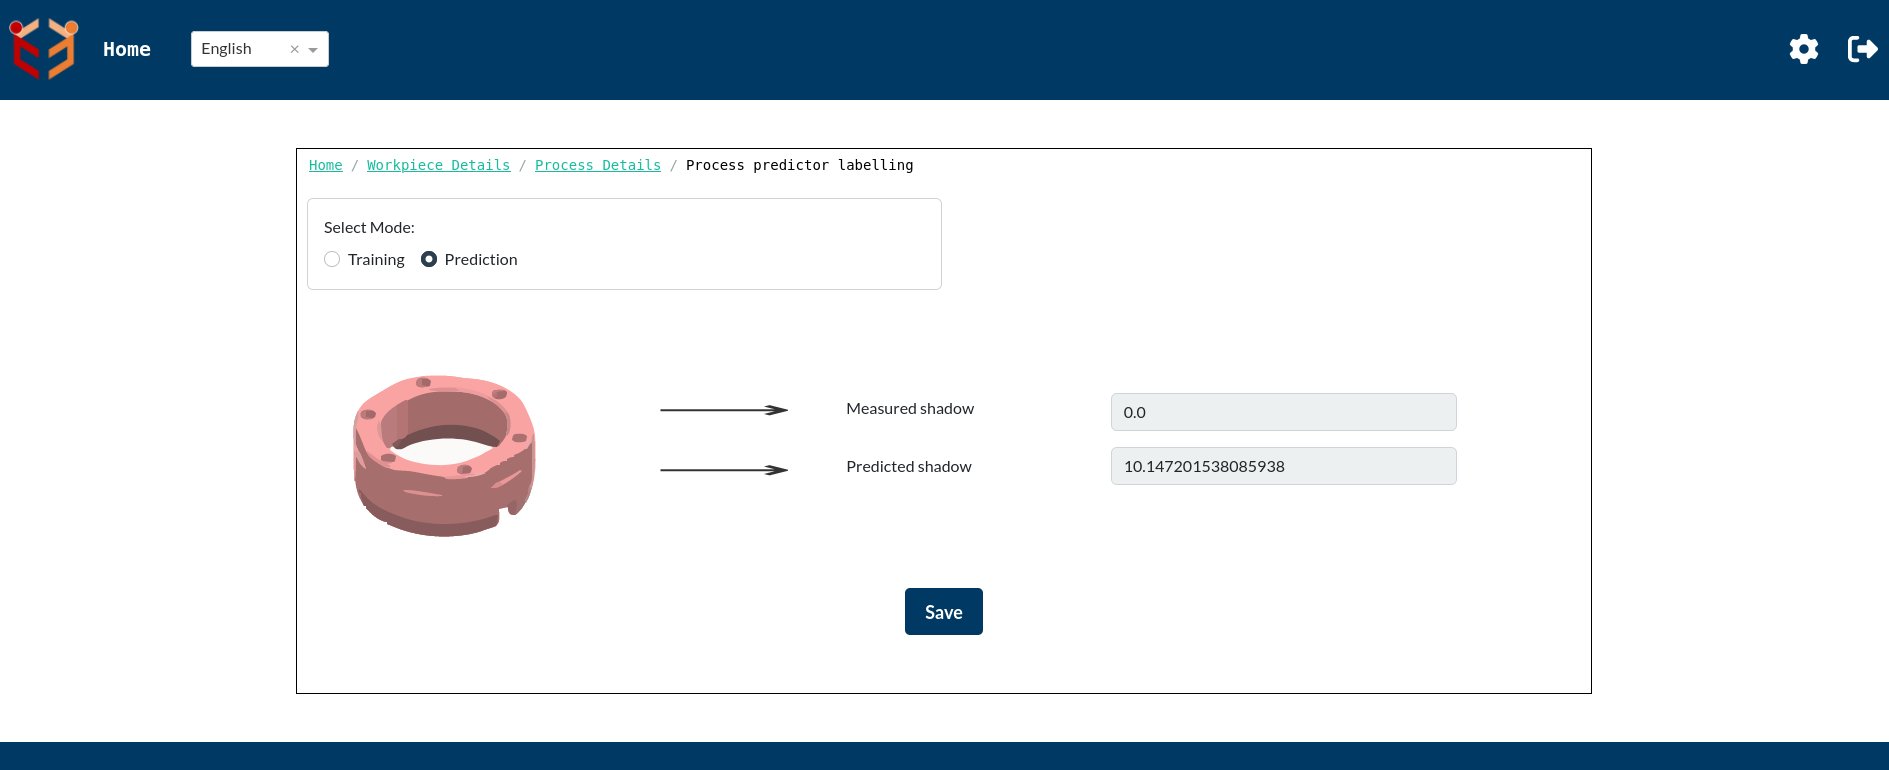
The above images show the Process Predictor Labelling Page for training and prediction respectively after clicking on the Relearn button. We can clearly see that Predicted shadow got updated for both training as well as prediction processes after completion of Relearn execution.
- Process Details Page- In the Work Piece Details configuration above,if we click on the '+' icon to the left of Tool column then we get process details page which shows single processes with that tool and its process data.
Validation state details:-
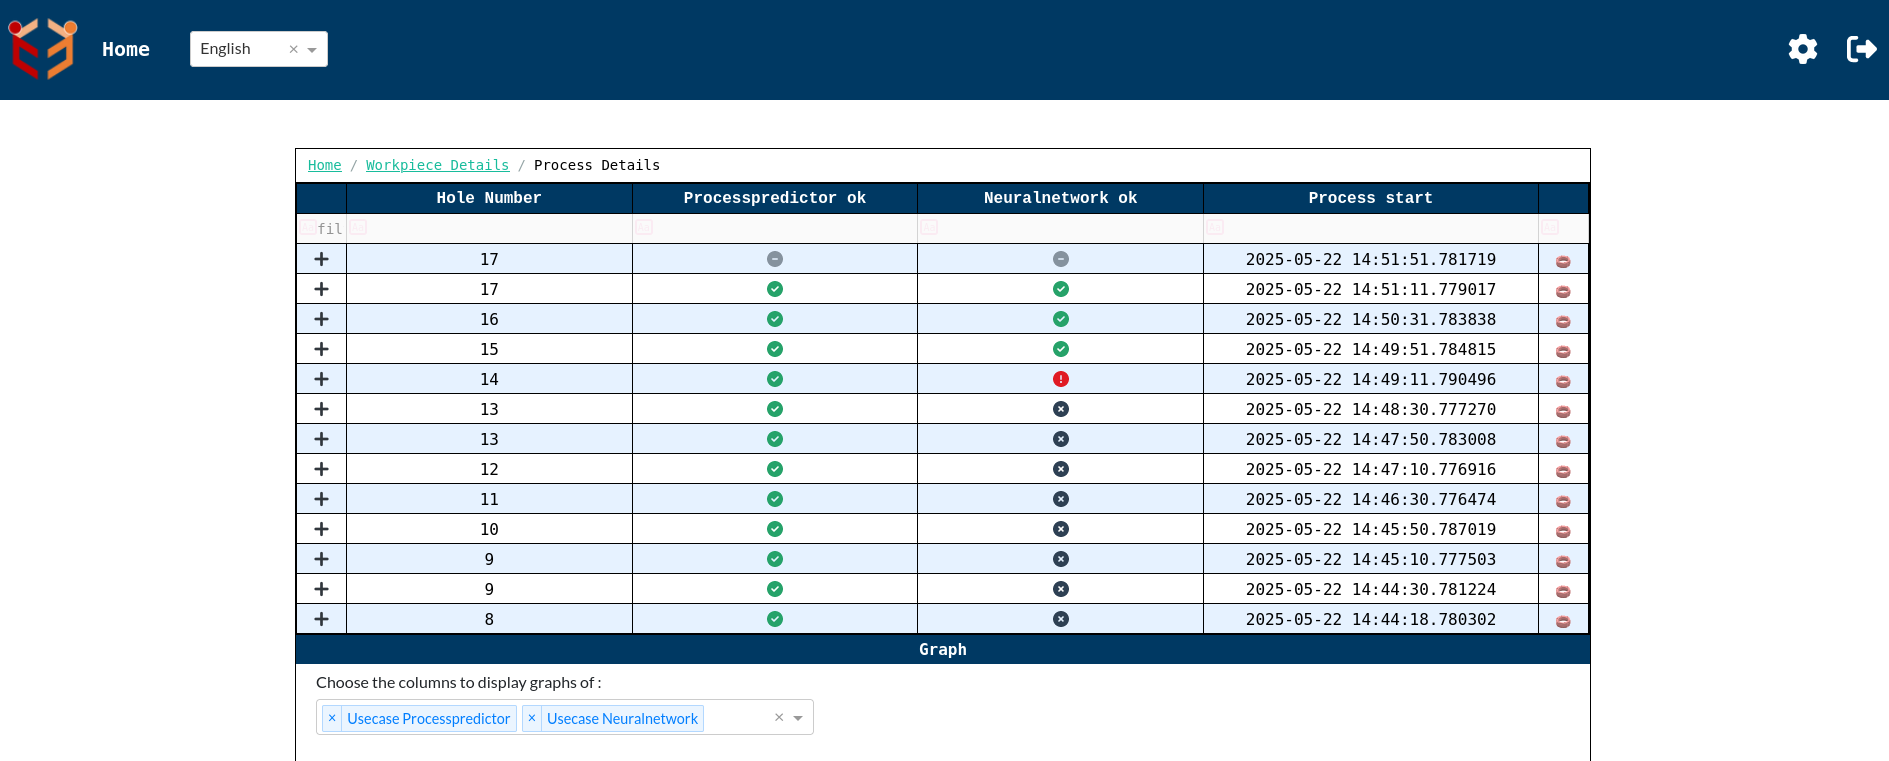
We can see a dropdown below the tabular column to select the columns to display the graph of. The neuralnetwork and processpredictor graphs are selected by default. We can select other columns as well according to our requirement.
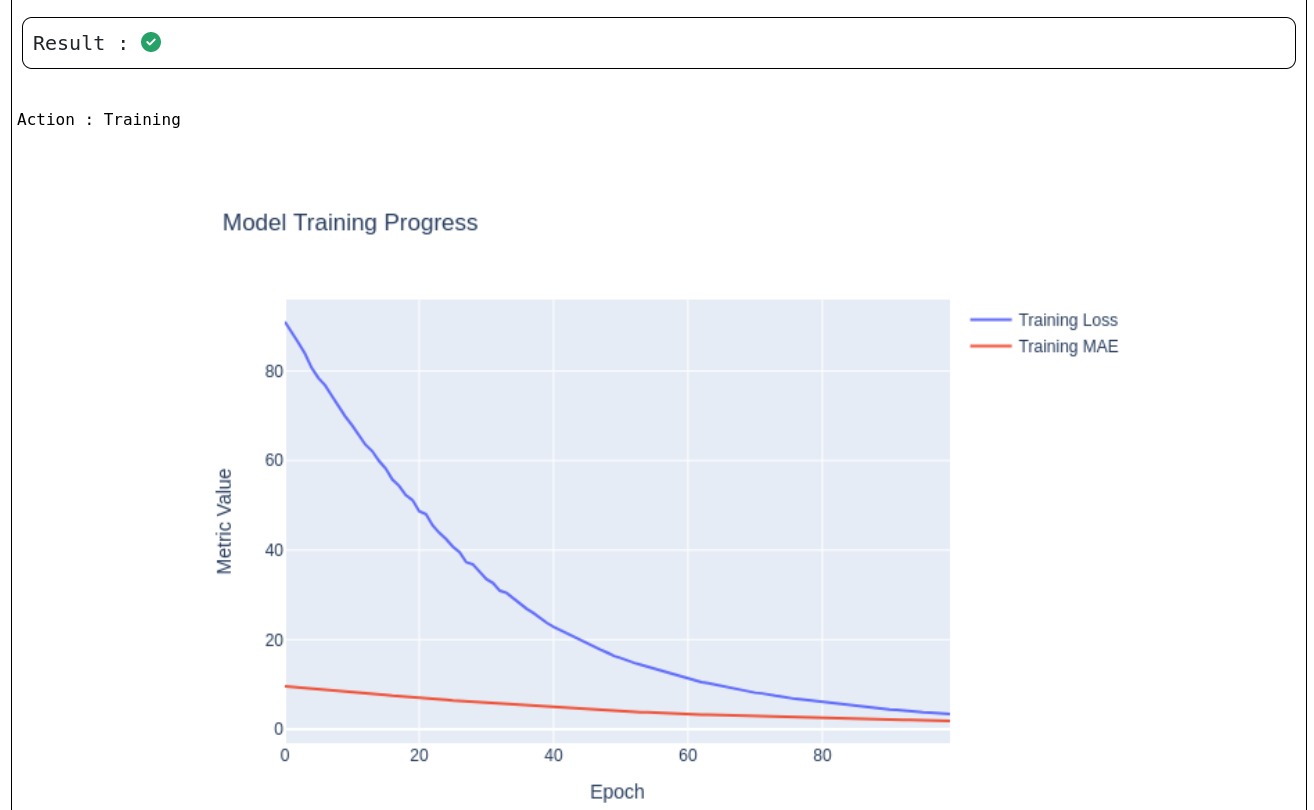
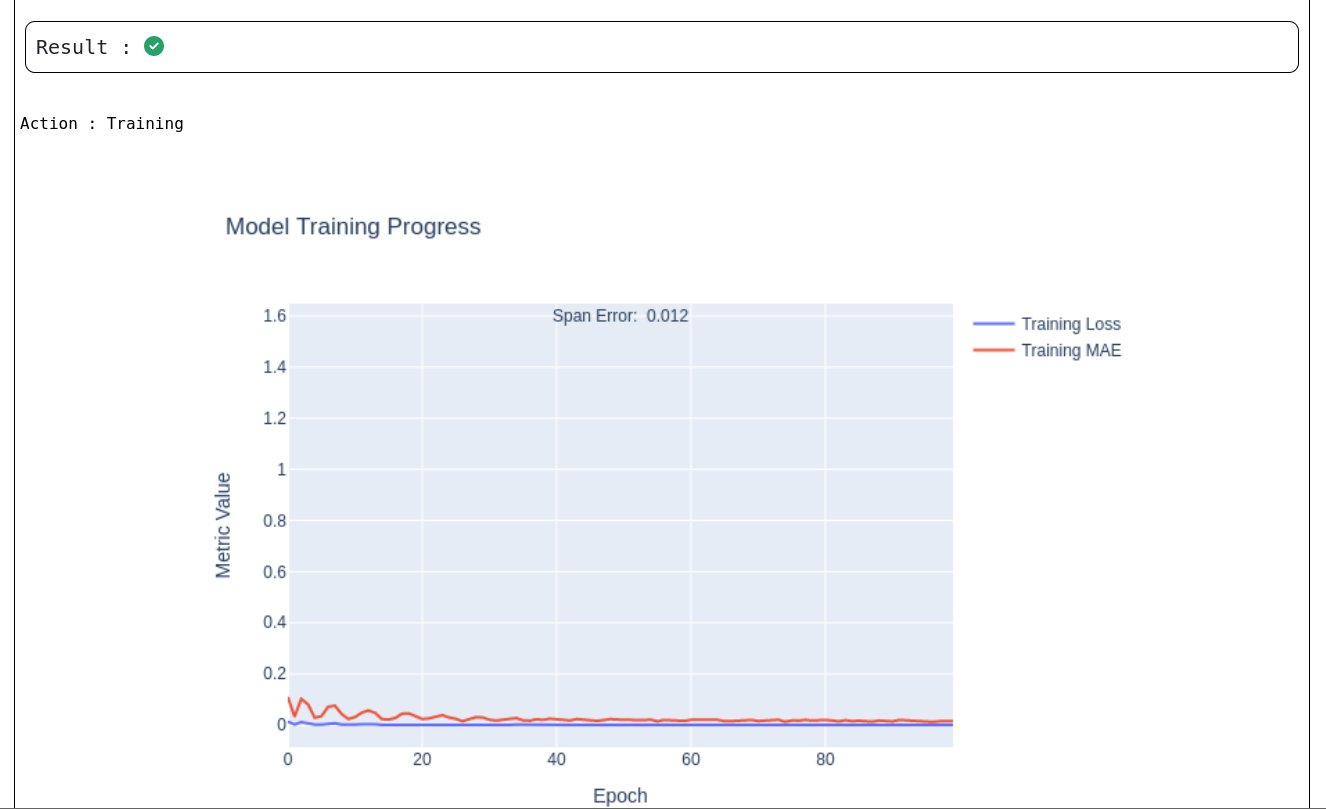
The Model Training Progress graphs above provides a visual representation of how the neural network learns over time during the training phase of the Process Predictor and Neuralnetwork use cases respectively.
X-axis (Epoch):
Represents the number of training iterations (0 to 100 epochs in this case).
Y-axis (Metric Value):
Reflects the values of key training metrics used to evaluate learning performance.
Plotted Metrics:
Training Loss (Blue Line): Indicates the overall loss function value during training, typically used for optimization.
Training MAE (Red Line): Shows the Mean Absolute Error, a measure of average prediction deviation from actual values.
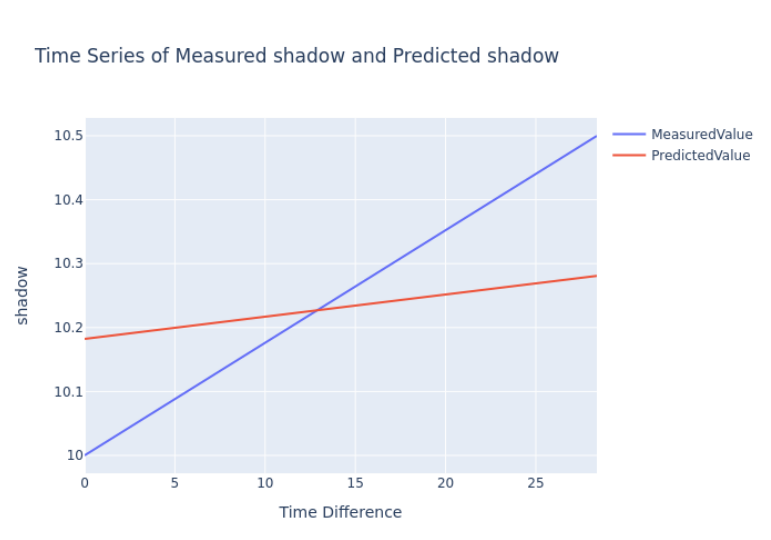
The above graph presents a time series comparison of measured and predicted values for the Process Predictor use case. It specifically illustrates the model's performance during the training phase, where measured values are available for evaluation.
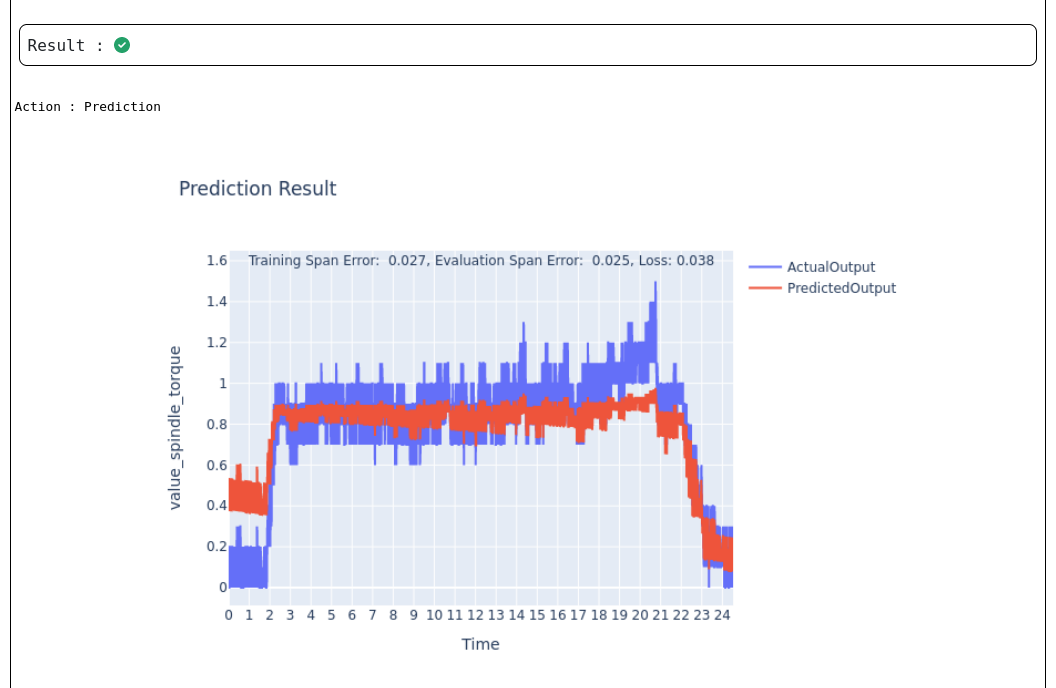
This chart above displays the outcome of the model's predictions for the Neuralnetwork use case. It compares the model's predicted output with the actual measured values over time, helping assess model accuracy and alignment with real-world data.
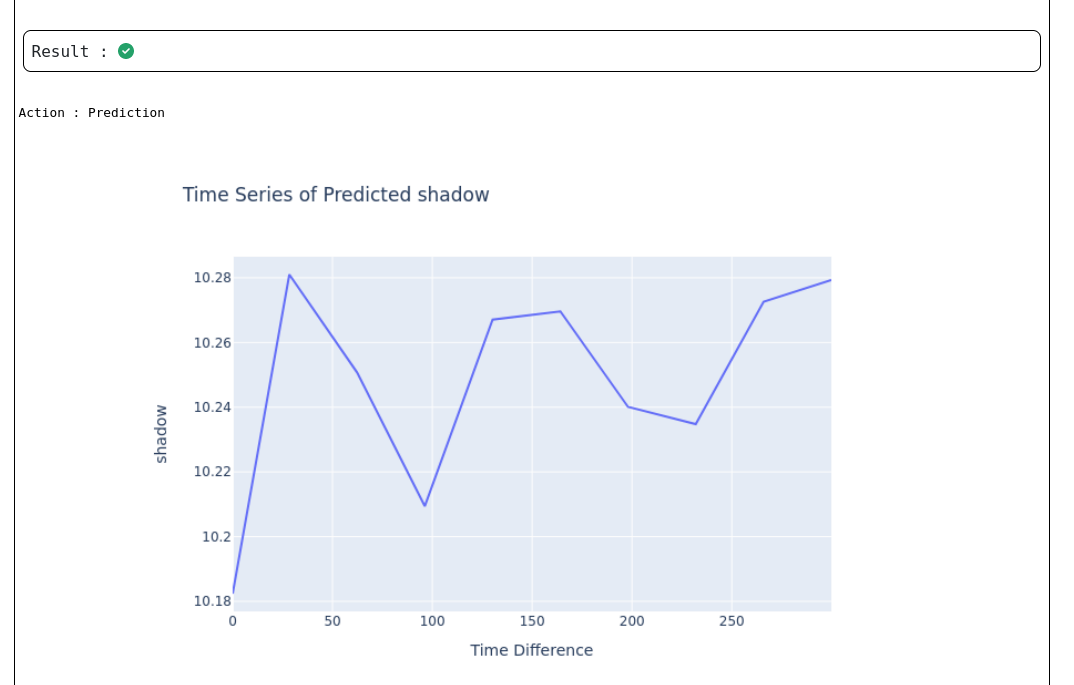
This chart above displays the outcome of the model's predictions for the Process Predictor use case. It is a time series graph which compares the model's predicted values against the actual time progression.
If we select the columns required from the dropdown and click on '+' in left of any process then we will get graphs such that time is on the x axis and selected column name on the Y axis as shown below.
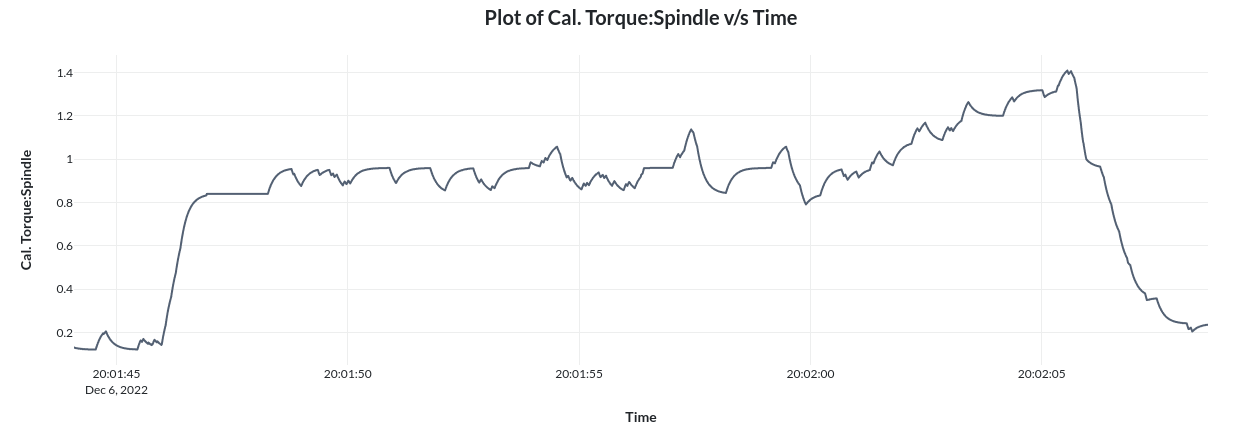
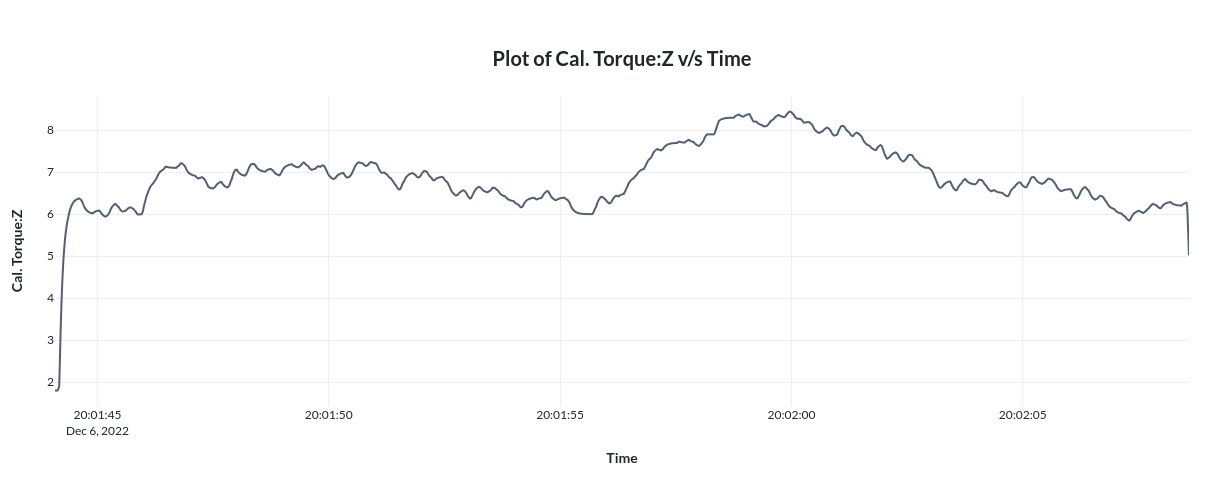
Note that contents shown in index page(view 0),work piece details page(view 1) and process details page(view 2) are completely customizable. Please refer the Configuration page under Usage section to know more about this.
¶ Technical Details
¶ REST Interface
DataViewer has a rest interface where the user can find all running information, detailed execution logs and current system status of the application.
The REST interface is internally used to interact with the web UI. The user interaction is thus captured from the web UI(front end) and sent to the REST interface which triggers certain actions on the backend.
For customizing the web UI address and port, provide it in the section Settings -> Expert Settings -> Rest API -> Port in the web UI.
- restServiceIp: Defines the IP address for the RESTful service (e.g., "0.0.0.0").
- restServicePort: Specifies the port for the RESTful service (e.g., 8080).
¶ Self Diagnosis
Details of runtime tests done on the Dataviewer application is available in Runtime Tests.
¶ Service Logs
Detailed execution logs can be viewed on this section.
¶ Settings
Application settings can be viewed/modified/deleted via this section. More detailed information is available at Configuration.